– Arjit Joshi
The heart’s beating appears to be a straightforward process. If the heartbeat had only included the cardiac muscles relaxing and contracting, the heart beating process would have been a piece of cake. In addition to the atrial systole, ventricular systole, and cardiac diastole, the heart’s beating mechanism also creates several waves. It was during the work experiencing programme in the winter vacation when I got to know that a heartbeat can be interpreted through waves. A wave that requires three paper strips to produce considering its complexity, a wave that is so intricate that it can make diagnosing heart-related conditions easier. One might wonder, “How precisely are these waves produced?” These waves are produced by a piece of equipment called an electrocardiograph, or ECG. The earliest known detection and recording of cardiac electrical activity occurred in 1887 when a British scientist by the name of Augustus Waller used a capillary electrometer to record the heart’s activity. This is the origin of the ECG. Einthoven originally introduced the word “electrocardiogram” to refer to these waveforms during the 1893 Dutch Medical Meeting. Moreover, Dutch scientist Willem Einthoven created the first usable ECG in 1903. He received the Nobel Prize in Physiology or Medicine for the same reason, which was an uplifting remark.
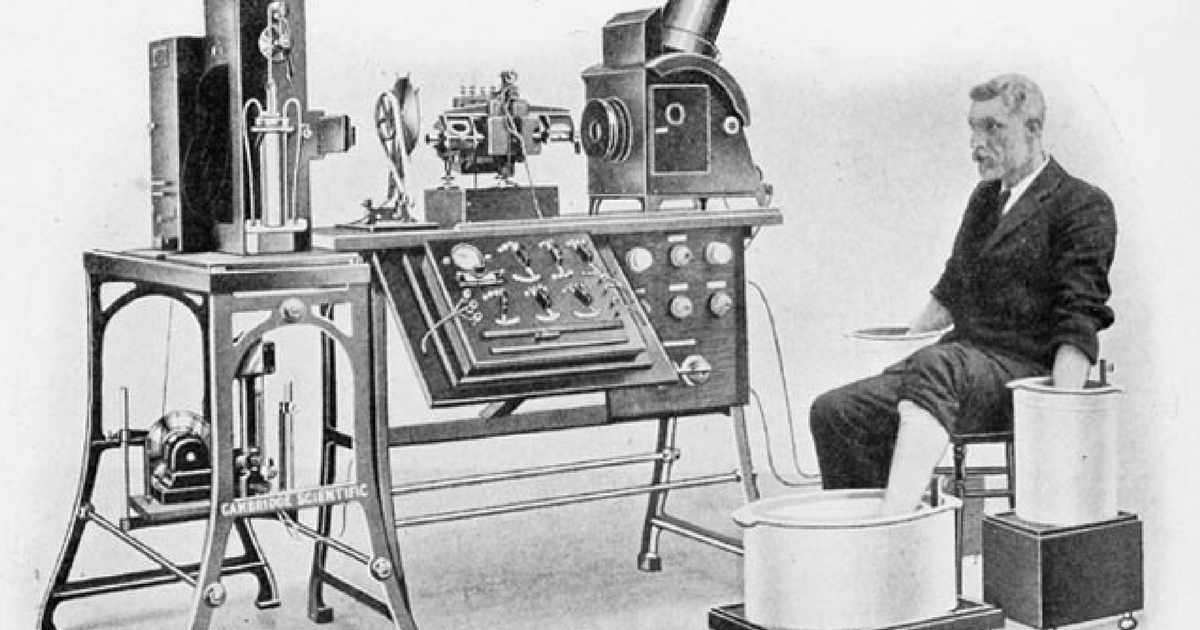
The process of creating an electrocardiogram, or an electrical activity record of the heart obtained through repeated cardiac cycles, is known as electrocardiography.A procedure so complex that the patient being examined had to submerge their limbs in saline solution. After a few years, conducting electrodes were introduced, which truly was a revolution. These electrodes pick up the minute electrical modifications brought about by the depolarization and repolarization of the heart muscle during each cardiac cycle (heartbeat). An electrogram is the expected output of an electrocardiogram, which uses electrodes applied to the skin to create a voltage versus time graph of the heart’s electrical activity. Diagnosing cardiac disorders is made easier since many cardiac problems result in changes to the normal ECG pattern.
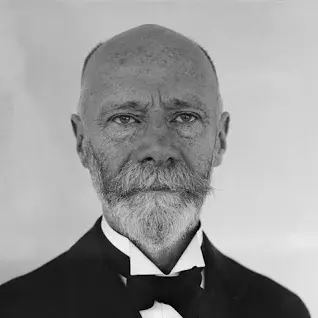

Fig: ECG procedure in the initial stages. Fig: ECG procedure currently

SAN, AVN And Purkinje Tissues: Three of the most vital structures
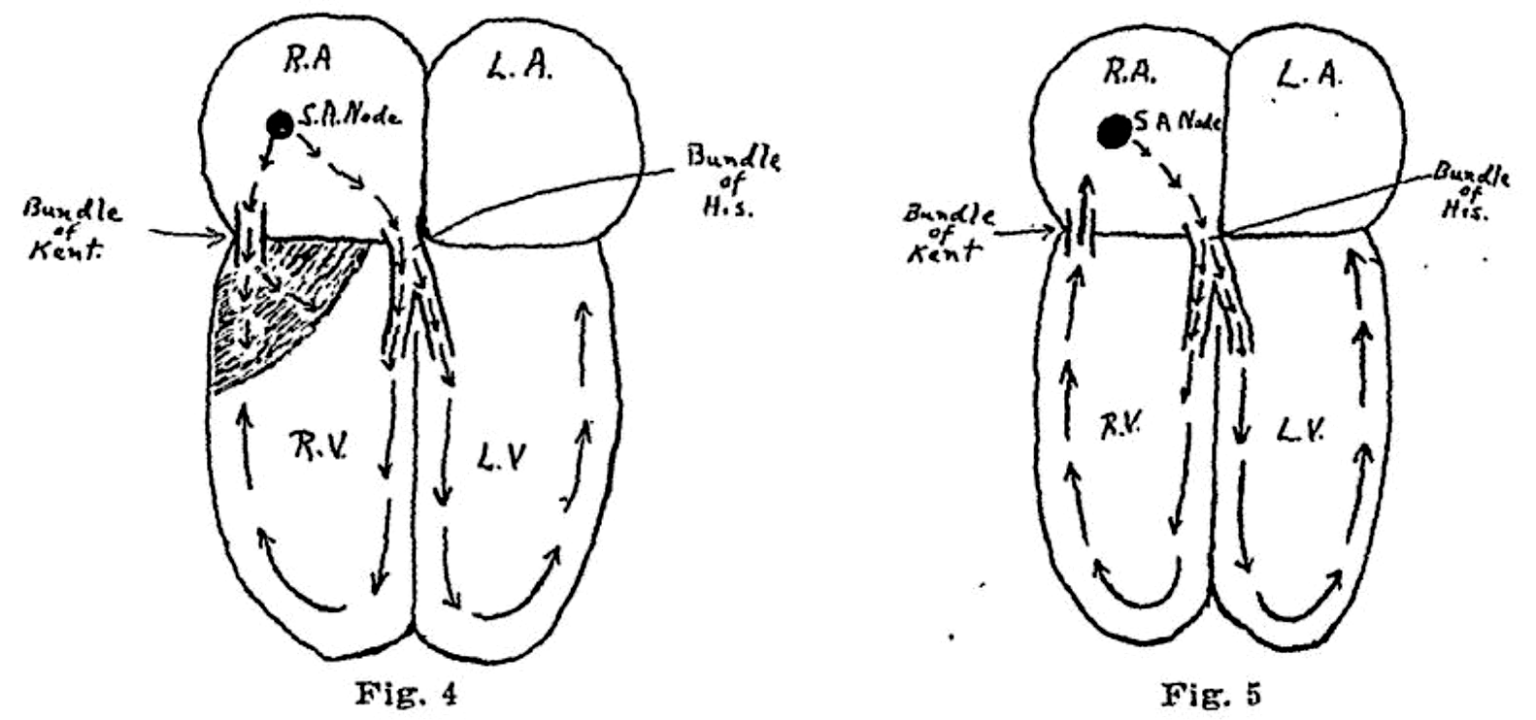
Actually, the cardiac muscles are myogenic, meaning they beat independently of nerve impulses. On the other hand, total dependence on its myogenic feature would result in an irregular heartbeat. This explains why a pacemaker or SAN (Sinoatrial Node) is present in the heart. Arterial walls then receive the electrical activity from the SAN, which causes its walls to constrict.
Why do the ventricles and atria not beat simultaneously?
The atria contract first, and the ventricles contract 0.1 seconds later. The inability of the electrical activity to immediately reach the walls of the ventricles is what causes this delay. The wave must first travel via the AVN (Atrioventricular Node) and Purkinje tissues before reaching the base of the septum. The ventricles contract as a result.
How are all the waves formed?
Before understanding the structure of the waves, we ought to understand the proper mechanism of an ECG.
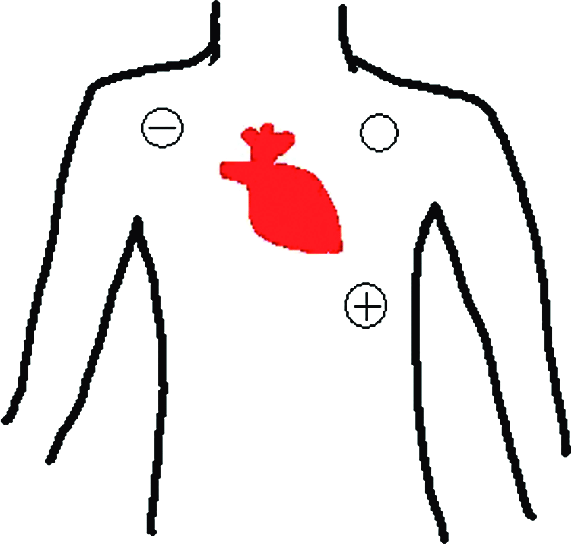
The electrodes in an ECG do not have a specific charge and are hence set automatically by the machinery itself.
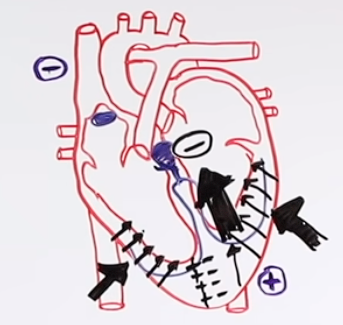
Note: The positive and the negative charges set at the end of the tissues represent the electrodes of an ECG.
Case 1
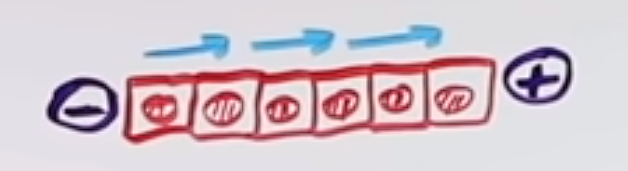
Let’s assume that a positive electrical activity forwards towards the positively charged end, this causes a positive deflection in the graph.
Case 2
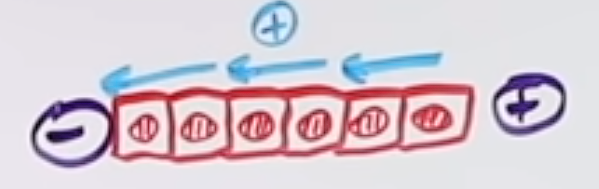
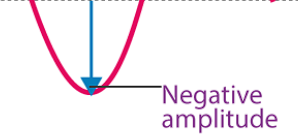
Let’s now assume that a positive electrical activity moves on the negatively charged end, this causes a negative deflection in the graph.
Case 3

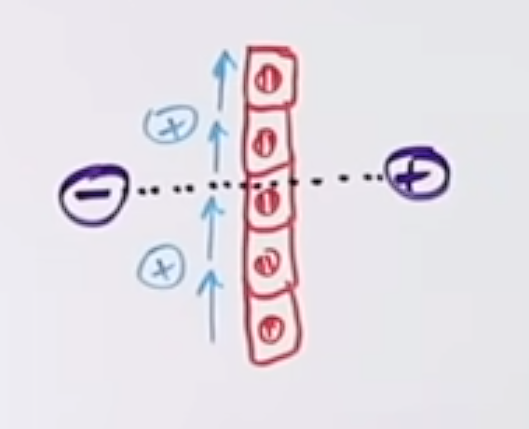
If the electrical activity is perpendicular to the axis of the electrode, there isn’t any deflection in such a case.
Having known the basics, we can now attempt to understand the different waves.
The most common lead used in a rhythm strip of 12 ecg is the lead II.
This also seems to be the best lead to interpret the formation of electrocardiograms.
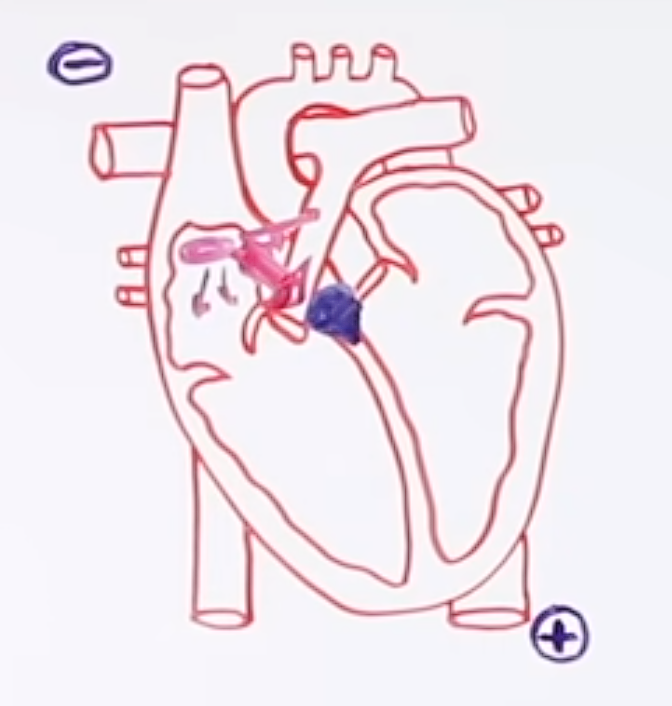
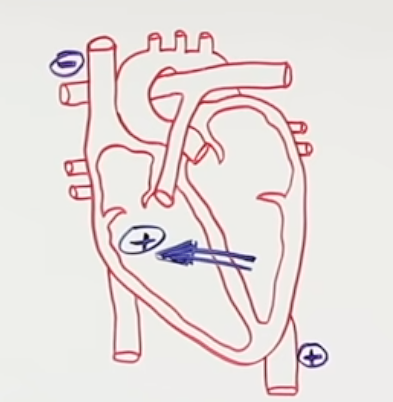
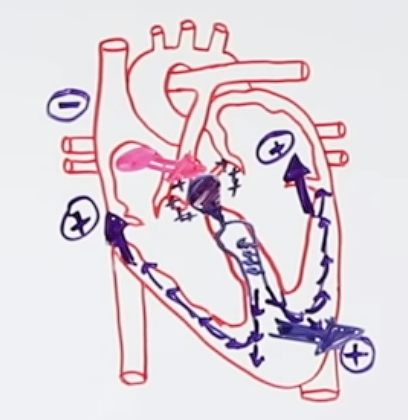
Starting from the SAN, action potential is generated. It is then spread throughout the atria in various directions. This is the part where we can sense a hint of physics. Out of all the electrical activities produced, the mean vector passes through the atrio-ventricular node. That positive deflection is atrial de-polarisation ‘p-wave’.
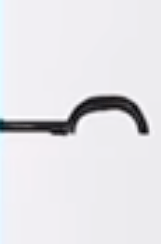
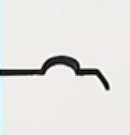
The large red arrow represents the mean vector Fig: A p-wave
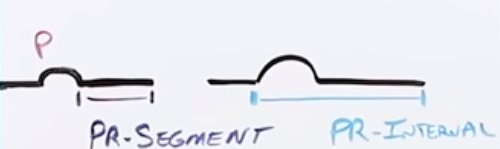
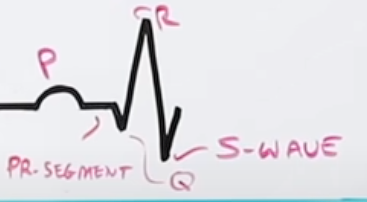
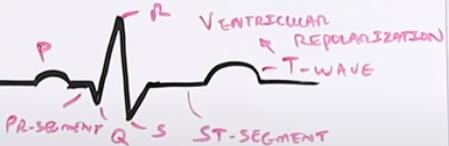
The Atrioventricular node is a slow conductor. There is a 0.1-second delay. During this time period, there isn’t any passage of electrical activity from the AV Node. Hence, there is no deflection in the wave (also known as an isoelectric line) “PR-segment”. This overall causes a PR interval in the wave.
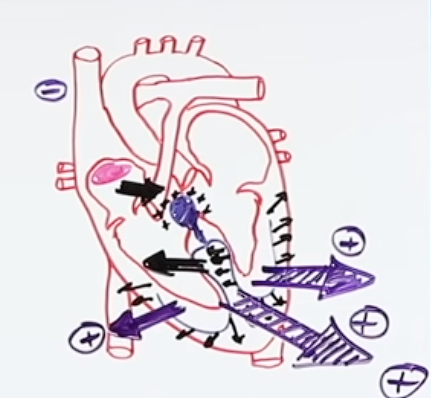
The electrical activity is then transferred from the AVN to the AV bundle (bundle of hiss). The electrical activity then reaches the bundle branches present at the vertebral septum. The left ventricle has a thicker wall, the left bundle branches generate an action potential to the direction of the interventricular septum. Since the positive electrical activity moves towards the negative electrode, a negative deflection occurs known as “septal de-polarization”. This causes the formation of a Q-wave.
Positive electrical activity moving to negative electrode The wave moving in the negative direction is the q-wave.
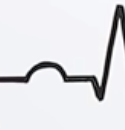
The action potential yet again moves towards the Purkinje tissue system. The direction of the action potential in all directions. However, the dominance of the mean vector is on the left due to the thick muscular wall of the left ventricle. This also is the reason why the amplitude of the graph is higher. The wave hence formed is known as an R-wave which represents “ventricular depolarization”.
A large mean vector due to the thick left ventricular walls. The wave with a large amplitude is the R-wave.
The action potential redirects itself and gradually starts moving in the upward direction towards the base of the ventricles. Since it is the positive electrical activity that is moving towards the negative electrode, a negative deflection is yet again achieved. This is known as the “de-polarization of the base of the ventricles” or the S-wave.
Action potential gradually preceding towards the base of ventricles
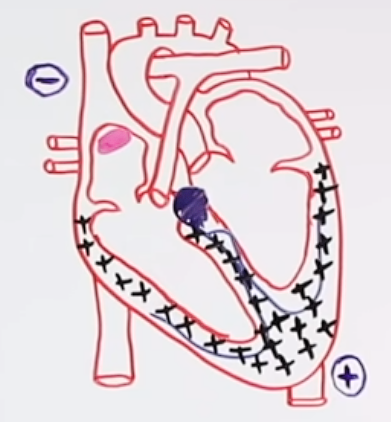
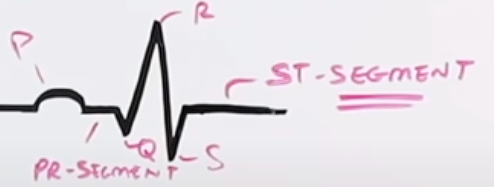
Due to action potential, the entire ventricular myocardial is depolarized “positively charged”. There isn’t any movement of charge. Hence, re polarization ought to occur. Nonetheless, during the repolarization time frame, due to no net electrical activity, an iso-electric wave is formed again known as the ST- segment.
The entirely positive ventricular myocardium is repolarized and the charges are now flipped to negative. The negative electrical activity again travels in the upward direction toward the negative electrode due to the effect of re-polarization. The amplitude of the wave hence formed has greater amplitude due to the thicker muscle of the left ventricle. The wave is known as “ventricular-repolarization” or S-wave.
What are the 12 ECG leads?
1. Bipolar lead (Limb lead)-3
LI, LII and LIII (Helps to look in the frontal, anterior and posterior plane.)
2. Augmented Unipolar lead-3
Augmented Unipolar Left (AVL), (Tells us about the parts of the right ventricle, interventricular septum)
Augmented Unipolar Right(AVR), (Tells us about the high lateral wall of the left ventricle)
Augmented Unipolar Front(AVF) (Tells us about the inferior wall of the heart)
3. Precordial (chest leads)
(v1-v6) (Helps look in the superior and inferior regions.)